
Introduction To Backend Logging
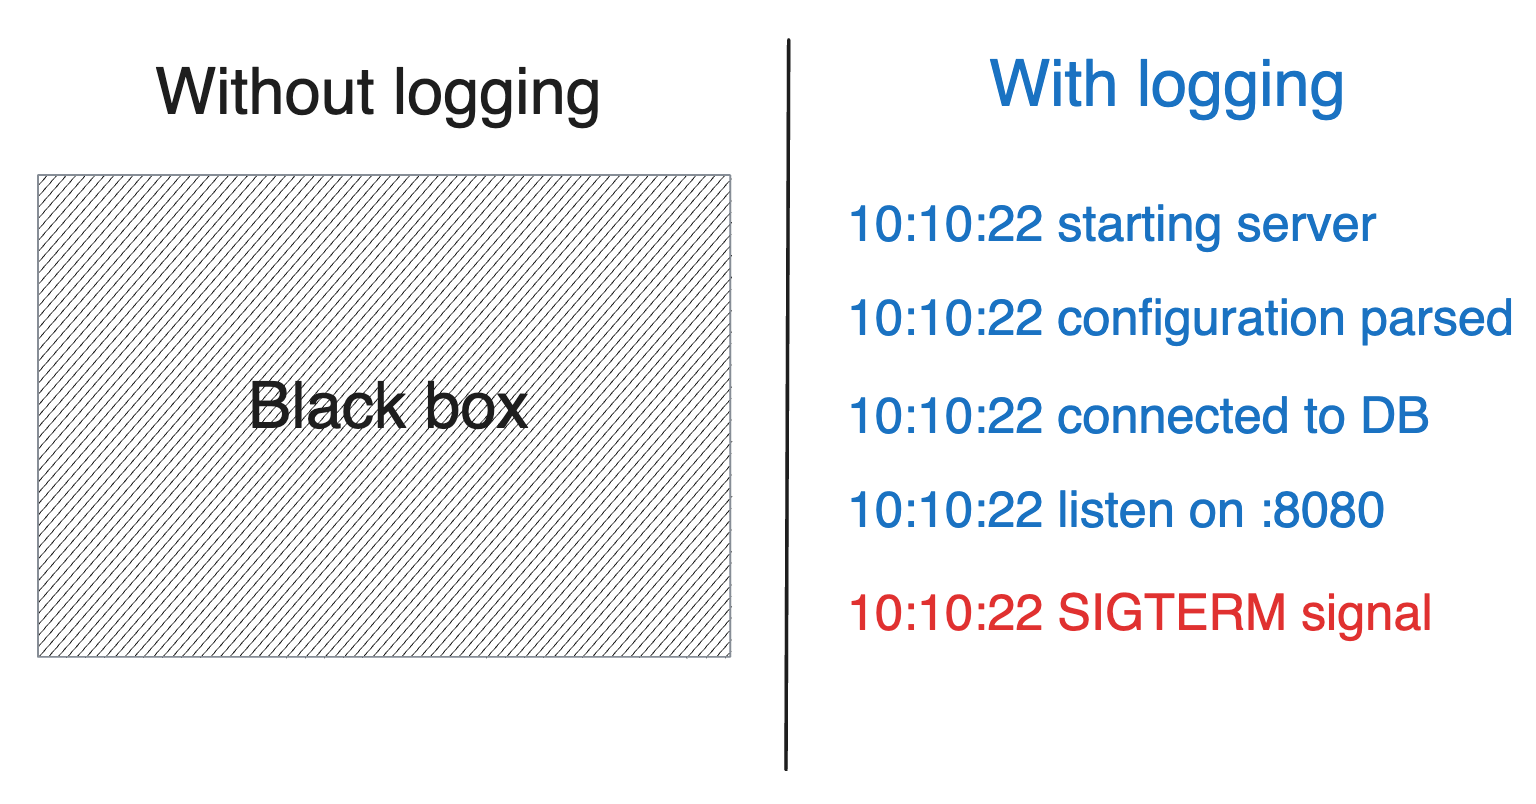
Simple logs, no traces, no metrics. Cheap and dirty.


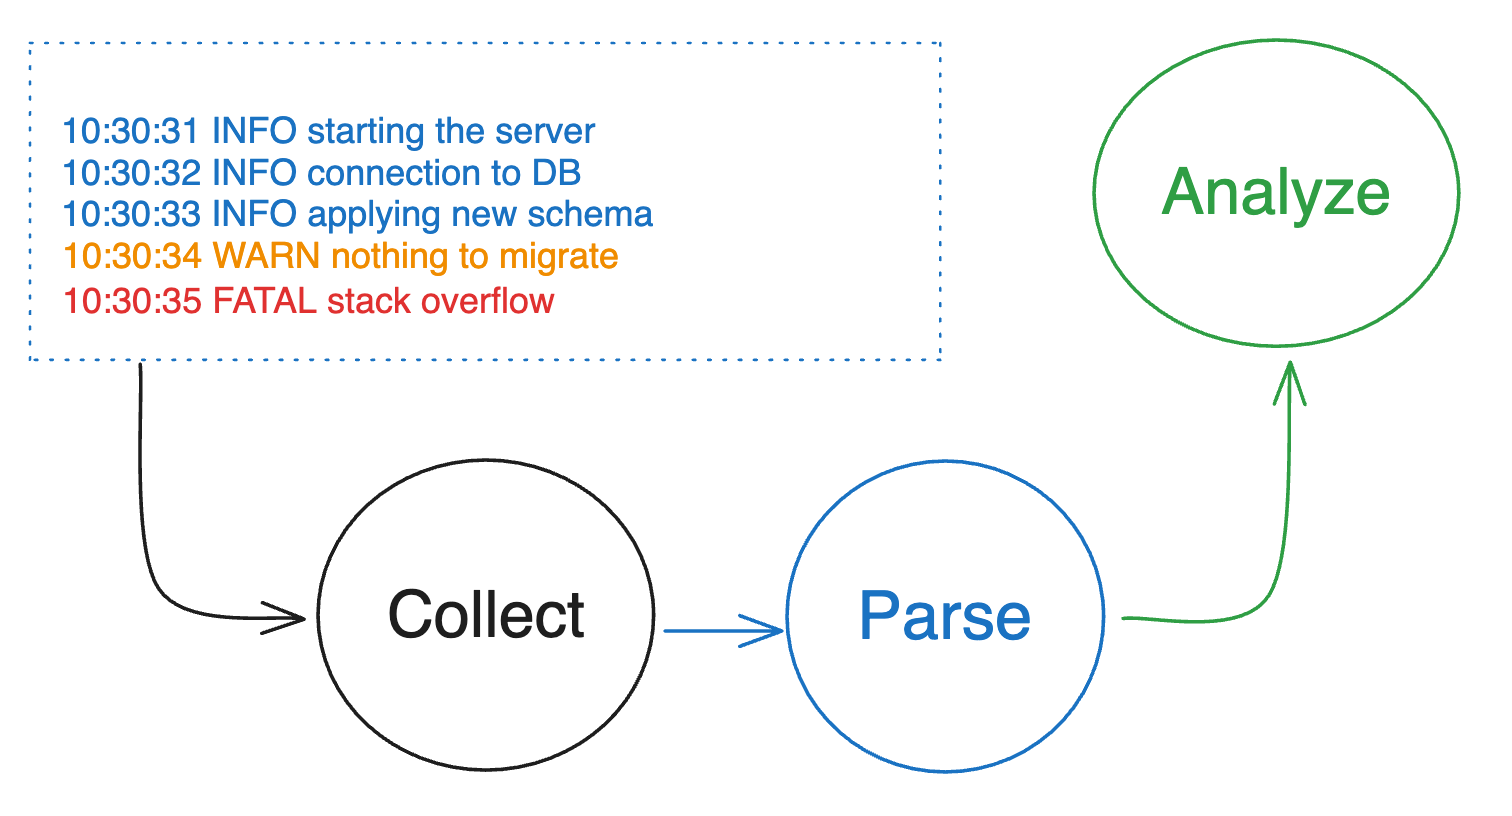
Logs, metrics, and traces are the three pillars of observability. However, logging is the most crucial among these three for good reasons.
These days, every type of application, including websites, mobile applications, and backend services, requires robust observability. Although these are all software, logging practices may vary, and practical implementations can differ significantly.
To narrow the scope of this expansive topic, this blog post will focus solely on logging for backend applications.
Why Logging is Important
Easy to Use and Works Out of the Box
Logging is the simplest approach to enable observability in an application. It typically works right out of the box with most modern languages and frameworks. There's no need to set up any third-party service, as you can simply write the logs to standard output or a basic file on a disk. In contrast, enabling tracing and metrics would require one or more external services.
Can Substitute Tracing and Metrics
If each log message your application produces is context-aware, for example, it has a unique request_id derived from the user request, you can use it to link multiple log events into a group. This gives you the same information as you would get from tracing spans.
The same method can be used to extract metrics from the logs. For instance, you can filter all the log messages during a certain period and gather statistics such as requests per second or error rate per endpoint.
Business Analytics
Traces are usually sampled and have a short retention period. Moreover, they lack the full context of an action or a process. On the other hand, logs are often stored for a longer period and, with the right tools, can provide extensive insights about the service, user behavior, and the product. This information is extremely valuable for business analytics.
How to Log Properly and What Should Be in the Logs
Main Process
When the application starts, it's essential to confirm that it has indeed started. A single log message stating “application has started” is sufficient to indicate this. However, after the start, it's also important to know whether the correct configuration was passed using flags or from the environment variables.
If the application reads the configuration from a CMS (Configuration Management System) and continuously monitors it, it would be sensible to log this as well. Naturally, all secrets and any sensitive information should be redacted or obfuscated, a topic we'll discuss later.
During the initiation, the service will likely attempt to connect to a database. Log two messages: one before the connection attempt and one after. Contrary to what some people on the internet suggest, merely logging a message after the connection was established or failed is not sufficient.
If there's no timeout to establish the connection, your application could be stuck for hours, and without looking into the source code, no one would know what's happening. This technique can be applied to all other external services and dependencies.
💡Tip: If you're using a relational database and implementing schema migrations, make a single query to get the current schema version and log it. This will help you avoid bugs in cases where the actual database schema diverges from the one used in the application code.
Certain properties derived from the configuration at the beginning can be passed to the global logger. We can refer to these as global context properties. Here's an example list with some properties:
Application version. You might have multiple versions of the application running on the same cluster, thus it’s important to understand which version is causing the issue or why this particular version is still running on production.
Git ref. Are you sure that you deployed the last commit? If not, just include it in the log message.
DB Schema version. You might have multiple instances of the database, where the migration is applied independently. Printing out the schema version can save you a few hours of debugging.
Container image or binary build timestamp. Logging the app version and git ref sometimes is not enough, as during different CI pipelines, build parameters were different for some reason, and it’s causing the issues.
Nowadays, many services are deployed using container images and run on orchestration systems like Kubernetes. As a result, the pod and node where the application instance is running become crucial and should be included in the logs.
Fortunately, logs are collected by a sidecar container and sent to centralized storage for further analytics, so we can omit these properties from the global context within the application itself.
Request Handling

In this section, I'll assume that we're discussing a service that exposes some API endpoints, handles user requests, performs some tasks, and returns a response. Depending on your application architecture, it might have one or multiple layers.
For instance, any backend API service typically has transport, service, and store layers. The request traverses all three layers, so you need to log at the beginning and end of each method. Here's an example of the log output you'll have after successfully serving a single user request:

As you can see, these six log messages provide some useful information: the time taken by each method across all three layers, timestamps, and the log level INFO, which indicates that all three actions were successful.
However, if we handle 100 requests simultaneously, it will become impossible to discern which log message belongs to which request. Moreover, if an action fails, the information provided by the logs won't be sufficient.
As a result, all your log messages should be context-aware. What does this mean? It means that each log message should correspond to a single request, and multiple log messages could be grouped together to describe the lifecycle of that request.
Here is a list of mandatory fields that should be included in the context to achieve our goal:
Request ID. It can fully replace trace ID if you don’t have any tracing. Even if you do, you have to pass the request ID from the client side to identify each request. This is the attribute that will group all your log messages that belong to a single request.
User ID. It will be enough to identify the authorized user in your system. This way, there is no need to capture any personal information.
Source. If you have different client types, like iOS, Android, and Web Applications, it’s good to include this field for further analytics.
Timestamp. This is the most important information for everything in software development! No further explanation is needed.
IP Address. If your API is exposed publicly, you might want to capture the IP address for fraud detection. Be careful, in some countries it’s illegal. However, you can include a hash of the IP address in your log messages.
Many more properties can be retrieved from the user request, and whether you should log them or not depends on the requirements of your product, security considerations, or analytics.
Event Handling
Modern systems typically consist of numerous microservices, necessitating event-based communication. Given that this communication is asynchronous, it's even more crucial to log these events and the actions they invoke.
The concept is similar to handling user requests, but events may be published or consumed in batches. If your service processes a batch of thousands of records, creating a log for each record would be highly inefficient. Instead, you can log the start and end offsets to indicate the range of events, along with some mandatory fields such as the source and timestamp of the batch.
Only in rare cases would you want to log the entire body of each event. Event-based communication is a broad topic that would warrant a dedicated article for a comprehensive explanation. I'll aim to discuss it in more detail in future posts.
Performance
In my experience, logging has often slowed down the performance of the application so much that it required the same amount of CPU resources as handling the request itself. This usually happens for a variety of reasons, but here is a list of major issues.
Logging to standard output without buffering and synchronously. Such a practice can easily slow down an application, especially during spikes. Just log asynchronously and use buffered outputs.
Logging the same data multiple times. As we discussed earlier, you can use something like
request_idto group log messages and output the related data just once.Slow logging library. The solution is very simple – use the one that performs best, does as few allocations as possible, and doesn’t block on writes. For example, zap is one of the best logging libraries for Go. In the README, it’s stated that its slowest competitor is ~15000% slower. Now you can imagine what would be the difference if your application is serving millions of requests per second per a single instance.
Cost Consideration
Logging is a very powerful tool that provides good observability of the application when done correctly. However, in the end, it helps us solve business problems, and businesses care about costs. How can we help the business save some money?

Log wisely. Sure, it’s easy to debug the service in production when you log each action, every request, and response body, but it will cost you a lot. Especially when you use managed services like Datadog or Splunk, it’s recommended to calculate the cost in advance.
Use compression. Log messages most of the time have a similar format and usually are ordered by timestamp, therefore compression can save you a lot of disk space and bandwidth.
Set smaller retention time. Storage is cheap, until the point when your application starts outputting terabytes of log messages per day. Deleting old logs will save you a lot of money. Make sure to align this with your company, sometimes it’s required to store the logs for a long time due to regulations or security policies.
Cold storage. If it’s required to store the logs for an indefinite period of time, consider cold storage. Solutions like AWS S3 Glacier are very cheap if you don’t query the data often.
Conclusion
Logging is an essential part of software development and it establishes a solid foundation for observability. It is a tool that can be easily integrated into any application, can replace more advanced techniques, and provides valuable data for the business.
This is not a comprehensive guide to logging, but all the practices described above should be enough for a good introduction. I've briefly covered other topics related to logging, such as performance and cost, but I’ll write more about them in future posts.